This page contains information about the performance of our Preseq software at predicting the complexity of DNA sequencing libraries. We are posting these results in order to initiate some kind of fair benchmarking for library complexity prediction methods.
We have not made any attempt to optimize speed or memory use for Preseq. Libraries need only be tested once, and as long as the time used by Preseq does not impact other analyses or hold up decisions on future sequencing, we are satisfied. That said, we are considering optimizing some of the computations due to the needs of other applications of the numerical algorithms used by Preseq.
The data sets listed here are intended to give some range of difficulty and diversity of prediction tasks. They were not selected to cover any particular range of biological applications. We would be very happy to include other data sets if you want to email us a suggestion.
If you have developed a method for predicting library complexity, and believe it outperforms Preseq (in terms of accuracy, not speed or memory) on the data sets listed here, then please contact us. Indicate how we can use your publicly available tool to get better results, and we will post those results. At the same time, if we improve Preseq we will post improved results.
All the data are from public resource and can be downloaded through NCBI.
Results
Predicting Library Complexity on various data sets
| Accession | Experiment | Layout | Mates in FE (M) | Reads in FE (M) | Mates in IE (M) | Observed distinct (M) | Predicted disinct (M) |
|---|---|---|---|---|---|---|---|
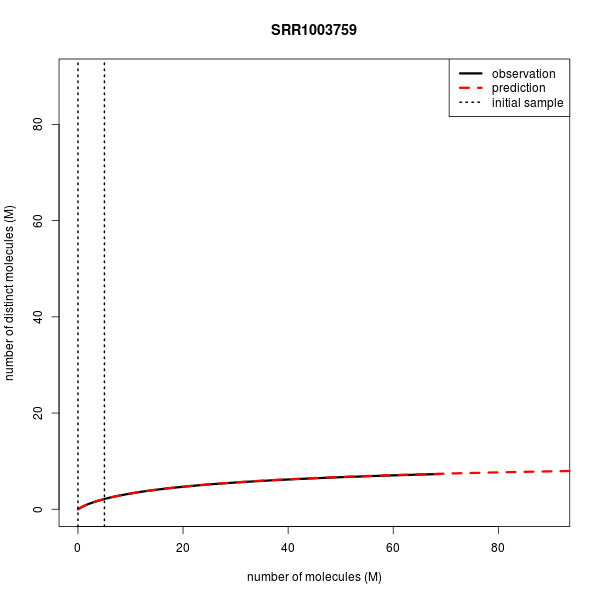
| SRR1003759 | Single-cell RNA-seq | Single | 69.1 | 69.1 | 5.0 | 7.328 | 7.378 |
| SRR1106616 | Single-cell RNA-seq | Single | 128.9 | 128.9 | 5.0 | 7.133 | 6.107 |
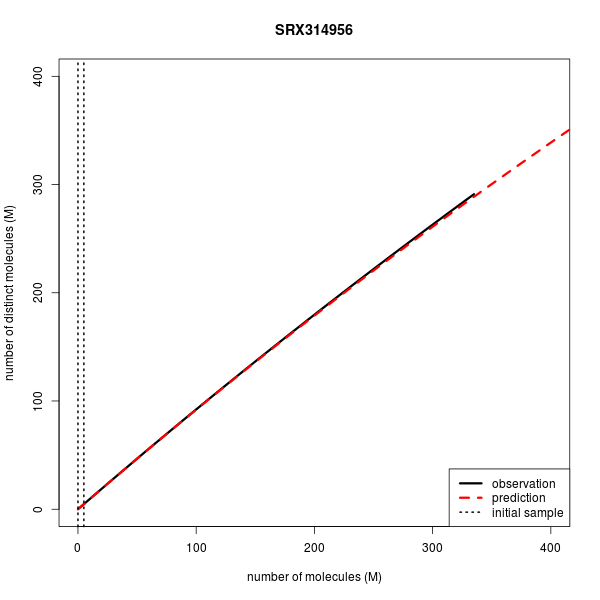
| SRX314956 | WGBS | Single | 335.3 | 335.3 | 5.0 | 291.361 | 288.991 |
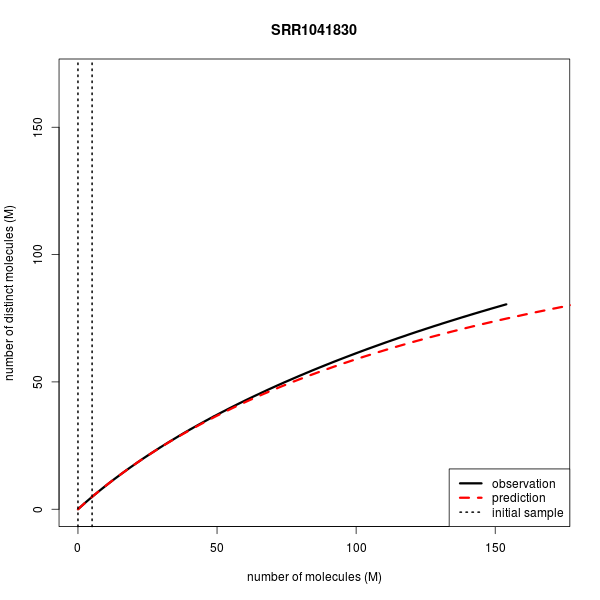
| SRR1041830 | ChIP-seq | Single | 154.1 | 154.1 | 5.1 | 80.507 | 74.883 |
| SRR975260 | Single-cell exome | Paired | 109.9 | 71.2 | 10.1 | 52.605 | 52.338 |
Note: Total Mates in FE stands for total number of mates in full experiment. Total Reads in FE stands for total reads in full experiment. Total Mates in IE stands for total mates in inital experiment. If the layout is single, the number of mates should be the exact number of reads. However, if it is paired, the number of mapped reads should be the number of mapped mates pairs plus any single mapped mates.
How the data were processed to obtain read counts histograms
Mapping
The RNA-seq aligner STAR is used to map RNA-seq data set SRR1003759 and SRR1003759. The reference is hg19. The Bisulfite-Seq data set SRX314956 is mapped by RMAP. The reference is mm9. The data set SRR1041830, SRR412891, SRR975260 are mapped by Bowtie 2. Hg 19 is the reference.
Sorting
Sort alignments by leftmost coordinates.
Sampling
Picard DownsampleSam is used to sample initial experiment except Bisulfite-Seq. The parameter is adjusted in such a way that, if it is single end sequencing, around 5M mapped reads are sampled out. If it is paired end sequencing, around 10M mapped mates are sampled. For Bisulfite-Seq, 5M reads are uniformly sampled without replacement.
Test Data
For each data set, the links below provide downloads for (1) the description, (2) the initial experiments as mapped reads, (3) the read count histograms and (4) complexity curves.
Complexity curves
Below are the complexity curves for preseq predictions when run on a subset of the data sets above.
Predicting the number of distinct molecules from RNA-seq of the whole transcriptome of the human single-cell.